机器学习入门算法——Kmeans(代码见文末)
。
Kmeans算法简介
K-means聚类是一种常用的无监督学习算法,用于将数据点划分为K个簇。该算法通过迭代过程将数据点分配到最近的簇中心(质心),然后更新质心位置,直到满足收敛条件。K-means聚类的主要目标是最小化簇内平方和(WCSS)。该算法简单高效,适用于大规模数据集,但需要预先指定簇的数量K,并且对初始质心的选择敏感。具体实现代码见文末。
算法逻辑
- 初始化质心:从数据集中随机选择K个点作为初始质心;
- 分配簇:计算每个数据点到各质心的距离,将其分配到最近的质心;
- 更新质心:计算每个簇中所有数据点的均值,作为新的质心;
- 收敛检查:如果质心变化小于阈值ℇ或达到最大迭代次数T,则停止迭代;
- 输出结果:返回最终簇分配和质心位置。
算法评价指标
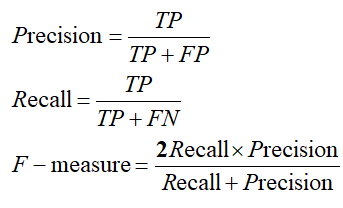
- F-measure:结合了精度和召回率两种指标,为精度与召回率的调和平均,具体公式如下:
符号定义与解释
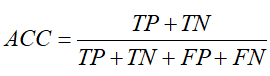
实际为正例 (P) 实际为负例 (N) 预测为正例 (P) TP (真正例) FP (假正例) 预测为负例 (N) FN (假负例) TN (真负例) - 准确率(ACC):被正确聚类的样本比例,计算公式为:
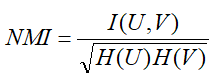
- 归一化互信息(NMI):衡量聚类结果与真实标签之间的一致性的信息量指标,计算公式如下:
符号定义与解释
符号 数学含义 物理意义 单位 U,V 两个离散随机变量(或聚类结果) 例如:数据集的不同聚类划分结果 无量纲 I(U,V) 互信息 (Mutual Information) 衡量 U 和 V 之间的统计依赖性 比特 (bit) H(U) 信息熵 (Entropy) 衡量 U 的不确定性(混乱程度) 比特 (bit) H(V) 同 H(U) 衡量 V 的不确定性 比特 (bit) - 兰德指数(RI):衡量聚类结果与真实标签之间的相似度,公式为:
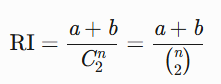
- n:数据集中的总样本数
- a:一致样本对的数量(两个样本在聚类和真实标签中属于同一类别)
- b:一致样本对的数量(两个样本在聚类和真实标签中属于不同类别)
- (2n)=2n(n−1):样本对的总可能数(组合数)
具体的指标解释信息参考机器学习理论相关内容。
开发环境
本算法的软件开发环境如表1-1所示,硬件环境如表1-2所示。
表1-1 软件环境表
|
终端 |
操作系统 |
应用软件 |
|
客户端 |
Windows 10 家庭版 64位 |
Python3.10,Streamlit,Pandas,Numpy,Matplotlib |
表1-2 硬件环境表
|
终端 |
机器名 |
配置说明 |
|
客户端 |
acer笔记本电脑 |
CPU:Intel(R) Core I5-1135G7 内存:16G 硬盘:250G |
系统要求
- Python(>=3.7)
- Streamlit(>=1.0)
- Pandas(>=1.0)
- NumPy(>=1.18)
- Matplotlib(>=3.0)
数据文件
数据集为CSV格式,包含多个特征列,最后一列为标签列(用于评估聚类结果)。
示例数据集从UCI数据集官网下载,地址为UCI Machine Learning Repository,经适当处理,把最后一列对应改为123,具体格式如表1-3所示。
表1-3 数据集格式表
|
特征1 |
特征2 |
特征3 |
特征4 |
标签 |
|
5.1 |
3.5 |
1.4 |
0.2 |
1 |
|
4.9 |
3 |
1.4 |
0.2 |
2 |
|
4.7 |
3.2 |
1.3 |
0.2 |
3 |
|
... |
... |
... |
... |
... |
算法实现概述
K-means聚类算法实现包含以下核心函数:
- 初始化与聚类函数:
initialize_centroids(data, k): 随机初始化K个质心
get_clusters(data, centroids): 将数据点分配到最近的质心
update_centroids(data, cluster_labels, k): 更新质心位置
k_means(data, k, T, epsilon): 主算法循环
2.评估指标计算:
compute_confusion_matrix(labels_true, labels_pred): 计算混淆矩阵
calculate_mutual_information(conf_matrix): 计算互信息
calculate_entropy(prob_dist): 计算熵
clustering_indicators(labels_true, labels_pred): 计算F-measure, ACC, NMI, RI
3.可视化函数
plot_clusters(data, labels, centroids, title): 绘制聚类结果
plot_iteration_history(data, history, iteration_key): 绘制迭代过程状态
算法接口
核心算法函数的各接口信息如表1-4所示。
表1-4算法接口表
|
函数名称 |
输入参数 |
输出结果 |
|
Kmeans |
data:数据集, k:簇数, T:最大迭代次数, epsilon:收敛阈值 |
labels:聚类标签, Centroids:质心, history:迭代历史, exec_time:执行时间 |
|
clustering_indicators |
labels_true:真实标签, labels_pred:预测标签 |
F_measure,ACC,NMI,RI: 聚类评估指标 |
算法参数
在本算法中涉及到的相关参数如表1-5所示。
表1-5 算法参数表
|
参数名 |
参数类型 |
参数取值 |
|
K |
int |
>=2 |
|
T |
int |
>=1 |
|
epsilon |
float |
1e-10~0.1 |
|
random_seed |
int |
任意整数 |
应用运行流程
在Pycharm中运行Kmeans.py文件
在命令提示符中输入命令streamlit run D:\PythonProject\Kmeans\.venv\Kmeans.py
网页页面操作流程
|
上传csv文件 |
|
设置聚类参数 |
|
点击运行按钮 |
|
查看聚类结果:数据预览,聚类评估指标,聚类结果可视化,迭代过程动画,聚类标签结果表 |
|
下载聚类结果csv文件 |
实验结果与分析
使用UCI开源鸢尾花数据集(iris.csv)进行聚类,设置K=3,T=10,ε=1e-5,随机种子=42。聚类结果如图
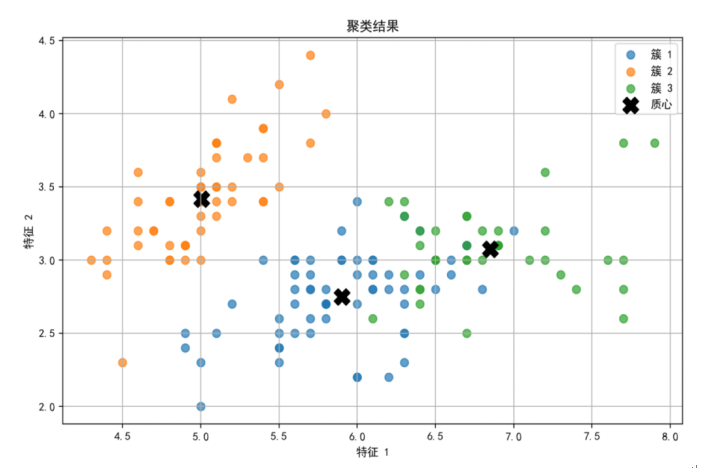
聚类结果指标如表1-6所示。
表1-6 聚类结果指标表
|
指标 |
值 |
|
F-measure |
0.8902 |
|
准确率(ACC) |
0.8933 |
|
归一化互信息(NMI) |
0.7582 |
|
兰德指数(RI) |
0.8797 |
实验分析:
- 准确率(ACC)达到89.33%,说明聚类结果与真实标签匹配度较高。
- 归一化互信息(NMI)为0.7582,表明聚类结果与真实标签之间有较高的互信息。
- 兰德指数(RI)为0.8797,说明聚类结果与真实标签之间的一致性较高
实现代码
注意,本段代码中没有涉及到高级调库,适合初学者理解Kmeans算法具体实现细节和算法指标评估。
import time
import pandas as pd
import matplotlib.pyplot as plt
import numpy as np
import streamlit as st

# 设置Matplotlib支持中文
plt.rcParams['font.sans-serif'] = ['SimHei', 'Microsoft YaHei']
plt.rcParams['axes.unicode_minus'] = False


# K-means算法函数
def initialize_centroids(data, k):
    """初始化质心"""
    centers = data[np.random.choice(data.shape[0], k, replace=False)]
    return centers


def get_clusters(data, centroids):
    """分配数据点到最近的质心"""
    distances = np.linalg.norm(data[:, np.newaxis] - centroids, axis=2)
    cluster_labels = np.argmin(distances, axis=1)
    return cluster_labels


def update_centroids(data, cluster_labels, k):
    """更新质心位置"""
    new_centroids = np.array([data[cluster_labels == i].mean(axis=0) for i in range(k)])
    return new_centroids


def k_means(data, k, T, epsilon):
    """K-means聚类算法"""
    start = time.time()
    centroids = initialize_centroids(data, k)
    history = {'centroids': [centroids.copy()]}

    t = 0
    while t <= T:
        cluster_labels = get_clusters(data, centroids)
        new_centroids = update_centroids(data, cluster_labels, k)

        history['centroids'].append(new_centroids.copy())
        history[f'iteration_{t}'] = cluster_labels.copy()

        if np.linalg.norm(new_centroids - centroids) < epsilon:
            break

        centroids = new_centroids
        t += 1

    end_time = time.time() - start
    return cluster_labels, centroids, history, end_time


# 评估指标函数
def compute_confusion_matrix(labels_true, labels_pred):
    """计算混淆矩阵"""
    labels_true = np.array(labels_true)
    labels_pred = np.array(labels_pred)

    unique_true = np.unique(labels_true)
    unique_pred = np.unique(labels_pred)
    n_true = len(unique_true)
    n_pred = len(unique_pred)

    conf_matrix = np.zeros((n_true, n_pred), dtype=int)

    for i, t in enumerate(unique_true):
        for j, p in enumerate(unique_pred):
            conf_matrix[i, j] = np.sum((labels_true == t) & (labels_pred == p))

    return conf_matrix, unique_true, unique_pred


def calculate_mutual_information(conf_matrix):
    """计算互信息(MI)"""
    total_points = np.sum(conf_matrix)
    pi = np.sum(conf_matrix, axis=1) / total_points
    pj = np.sum(conf_matrix, axis=0) / total_points
    pij = conf_matrix / total_points

    mi = 0.0
    for i in range(conf_matrix.shape[0]):
        for j in range(conf_matrix.shape[1]):
            if pij[i, j] > 0:
                mi += pij[i, j] * np.log2(pij[i, j] / (pi[i] * pj[j]))

    return max(0, mi)


def calculate_entropy(prob_dist):
    """计算概率分布的熵"""
    non_zero_probs = prob_dist[prob_dist > 0]
    entropy = -np.sum(non_zero_probs * np.log2(non_zero_probs))
    return entropy


def clustering_indicators(labels_true, labels_pred):
    """计算聚类评价指标"""
    conf_matrix, unique_true, unique_pred = compute_confusion_matrix(labels_true, labels_pred)
    total_points = np.sum(conf_matrix)

    # ACC
    row_ind = np.arange(conf_matrix.shape[0])
    col_ind = np.argmax(conf_matrix, axis=1)
    acc = np.sum(conf_matrix[row_ind, col_ind]) / total_points

    # NMI
    mi = calculate_mutual_information(conf_matrix)
    pi = np.sum(conf_matrix, axis=1) / total_points
    h_true = calculate_entropy(pi)
    pj = np.sum(conf_matrix, axis=0) / total_points
    h_pred = calculate_entropy(pj)
    nmi = (2 * mi) / (h_true + h_pred) if h_true + h_pred > 0 else 1.0

    # RI
    total_pairs = total_points * (total_points - 1) / 2
    same_true = np.sum(
        [np.sum(conf_matrix[i, :]) * (np.sum(conf_matrix[i, :]) - 1) / 2 for i in range(conf_matrix.shape[0])])
    same_pred = np.sum(
        [np.sum(conf_matrix[:, j]) * (np.sum(conf_matrix[:, j]) - 1) / 2 for j in range(conf_matrix.shape[1])])
    agree = np.sum([conf_matrix[i, j] * (conf_matrix[i, j] - 1) / 2 for i in range(conf_matrix.shape[0]) for j in
                    range(conf_matrix.shape[1])])
    a = agree
    d = total_pairs - same_true - same_pred + agree
    ri = (a + d) / total_pairs

    # F-measure
    precision_list = [np.max(conf_matrix[:, j]) / np.sum(conf_matrix[:, j]) if np.sum(conf_matrix[:, j]) > 0 else 0.0
                      for j in range(conf_matrix.shape[1])]
    recall_list = [np.max(conf_matrix[i, :]) / np.sum(conf_matrix[i, :]) if np.sum(conf_matrix[i, :]) > 0 else 0.0
                   for i in range(conf_matrix.shape[0])]

    f_measure = 0.0
    for i in range(len(unique_true)):
        prec = precision_list[i] if i < len(precision_list) else 0
        rec = recall_list[i]
        if prec + rec > 0:
            f_measure += 2 * (prec * rec) / (prec + rec)

    f_measure /= max(1, min(len(unique_true), len(unique_pred)))

    return f_measure, acc, nmi, ri


# 可视化函数
def plot_clusters(data, labels, centroids, title="聚类结果"):
    """绘制聚类结果"""
    fig, ax = plt.subplots(figsize=(10, 6))

    # 如果数据是多维的,只取前两个特征
    if data.shape[1] > 2:
        data = data[:, :2]
        centroids = centroids[:, :2]

    # 绘制簇
    unique_labels = np.unique(labels)
    for i in unique_labels:
        cluster_data = data[labels == i]
        ax.scatter(cluster_data[:, 0], cluster_data[:, 1],
                   label=f'簇 {i + 1}', alpha=0.7, s=50)

    # 绘制质心
    ax.scatter(centroids[:, 0], centroids[:, 1],
               marker='X', s=200, c='black', label='质心')

    ax.set_title(title)
    ax.set_xlabel('特征 1')
    ax.set_ylabel('特征 2')
    ax.legend()
    ax.grid(True)

    return fig


def plot_iteration_history(data, history, iteration_key):
    """绘制迭代过程中的聚类状态"""
    # 检查迭代键是否存在
    if iteration_key not in history:
        return None

    # 获取迭代序号(从 'iteration_X' 中提取数字)
    try:
        iter_num = int(iteration_key.split('_')[-1])
    except ValueError:
        return None

    # 确保质心列表有足够元素
    if iter_num >= len(history['centroids']):
        return None

    fig, ax = plt.subplots(figsize=(10, 6))

    # 获取标签和质心
    labels = history[iteration_key]
    centroids = history['centroids'][iter_num]  # 使用整数索引

    # 如果数据是多维的,只取前两个特征
    if data.shape[1] > 2:
        data = data[:, :2]
        centroids = centroids[:, :2]

    # 绘制簇
    unique_labels = np.unique(labels)
    for i in unique_labels:
        cluster_data = data[labels == i]
        ax.scatter(cluster_data[:, 0], cluster_data[:, 1],
                   label=f'簇 {i + 1}', alpha=0.7, s=50)

    # 绘制质心
    ax.scatter(centroids[:, 0], centroids[:, 1],
               marker='X', s=200, c='black', label='质心')

    ax.set_title(f'迭代 {iter_num} 的聚类状态')
    ax.set_xlabel('特征 1')
    ax.set_ylabel('特征 2')
    ax.legend()
    ax.grid(True)

    return fig


# Streamlit应用
def main():
    st.set_page_config(page_title="K-means聚类可视化", layout="wide")
    st.title("K-means聚类算法可视化")

    # 侧边栏配置
    with st.sidebar:
        st.header("参数配置")

        # 文件上传
        uploaded_file = st.file_uploader("上传CSV文件", type=["csv"])

        # 聚类参数
        k = st.number_input("簇数量 (K)", min_value=2, max_value=10, value=3)
        T = st.number_input("最大迭代次数 (T)", min_value=1, max_value=100, value=10)
        epsilon = st.number_input("收敛阈值 (ε)", min_value=1e-10, max_value=0.1, value=1e-5, format="%.1e")
        random_seed = st.number_input("随机种子", min_value=0, value=42)

        # 执行按钮
        run_button = st.button("运行K-means聚类")

    # 主内容区
    if uploaded_file is None:
        st.info("请上传一个CSV文件以开始")
        return

    # 加载数据
    try:
        df = pd.read_csv(uploaded_file)
        columns = list(df.columns)
        features = columns[:-1]  # 假设最后一列是标签
        dataset = df[features].values
        original_labels = df[columns[-1]].values

        # 显示数据
        st.subheader("数据预览")
        st.write(df.head())

        # 显示数据统计信息
        st.subheader("数据统计")
        st.write(df.describe())

    except Exception as e:
        st.error(f"加载数据出错: {str(e)}")
        return

    # 运行聚类
    if run_button:
        st.subheader("聚类结果")
        progress_bar = st.progress(0)
        status_text = st.empty()

        # 设置随机种子
        np.random.seed(random_seed)

        # 执行聚类
        try:
            status_text.text("执行K-means聚类中...")
            labels, centroids, history, exec_time = k_means(dataset, k, T, epsilon)
            progress_bar.progress(1.0)

            # 显示执行时间
            st.success(f"聚类完成! 用时: {exec_time:.4f}秒, 迭代次数: {len(history) - 1}")

            # 评估聚类结果
            F_measure, ACC, NMI, RI = clustering_indicators(original_labels, labels)

            # 显示评估指标
            st.subheader("聚类评估指标")
            metrics_data = {
                "指标": ["F-measure", "准确率 (ACC)", "归一化互信息 (NMI)", "兰德指数 (RI)"],
                "值": [F_measure, ACC, NMI, RI]
            }
            st.table(metrics_data)

            # 绘制聚类结果
            st.subheader("聚类结果可视化")
            fig = plot_clusters(dataset, labels, centroids)
            st.pyplot(fig)

            # 迭代过程可视化
            st.subheader("聚类过程动画")

            # 创建迭代动画
            col1, col2 = st.columns(2)
            for i in range(min(5, len(history) - 1)):
                fig = plot_iteration_history(dataset, history, f'iteration_{i}')
                if fig:
                    if i % 2 == 0:
                        col1.pyplot(fig)
                    else:
                        col2.pyplot(fig)

            # 显示最终聚类标签
            st.subheader("聚类标签")
            result_df = df.copy()
            result_df['聚类标签'] = labels
            st.write(result_df)

            # 下载结果
            st.download_button(
                label="下载聚类结果",
                data=result_df.to_csv(index=False).encode('utf-8'),
                file_name='聚类结果.csv',
                mime='text/csv',
            )

        except Exception as e:
            st.error(f"聚类过程中出错: {str(e)}")


if __name__ == "__main__":
    main()
📌 [ 笔者 ] 小树晒太阳
📜 [ 声明 ] 由于作者水平有限,本文有错误和不准确之处在所难免,
本人也很想知道这些错误,恳望读者批评指正!

脑启社区是一个专注类脑智能领域的开发者社区。欢迎加入社区,共建类脑智能生态。社区为开发者提供了丰富的开源类脑工具软件、类脑算法模型及数据集、类脑知识库、类脑技术培训课程以及类脑应用案例等资源。
更多推荐


 45
45 0
0- 0


 已为社区贡献1条内容

所有评论(0)