ML 乳腺癌预测
给出的所需元器件库所需的元器件库也列在 Libraries Used (使用的元器件库) 下方。通过创建数据帧并输入准确率分数和相应的机器学习模型,比较了 4 种机器学习模型的预测。测试训练拆分如下: 训练(398 行) : 测试(171 行) :: 70 : 30。创建了一个机器学习模型,通过分析数据集中给出的因素和变量来预测乳腺癌。图 II:这是定义数据集中给定的不同变量/因素之间相关性的热图
目的:
本项目的目的是
- 关于恶性和良性癌症的研究。
- 关于探索性数据分析的研究。
- 研究不同的机器学习模型并进行比较。
描述:
创建了一个机器学习模型,通过分析数据集中给出的因素和变量来预测乳腺癌。
通过创建数据帧并输入准确率分数和相应的机器学习模型,比较了 4 种机器学习模型的预测。
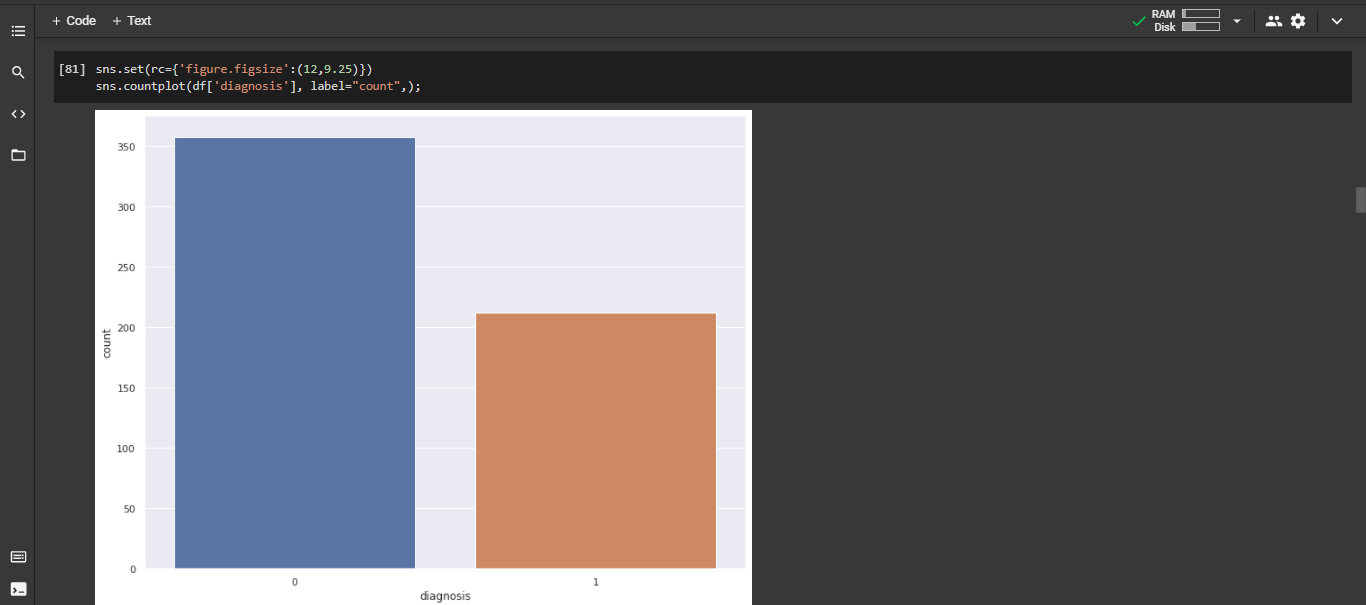
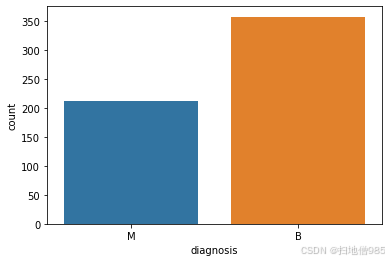
图 I:这是定义恶性癌症和良性癌症计数的计数图。
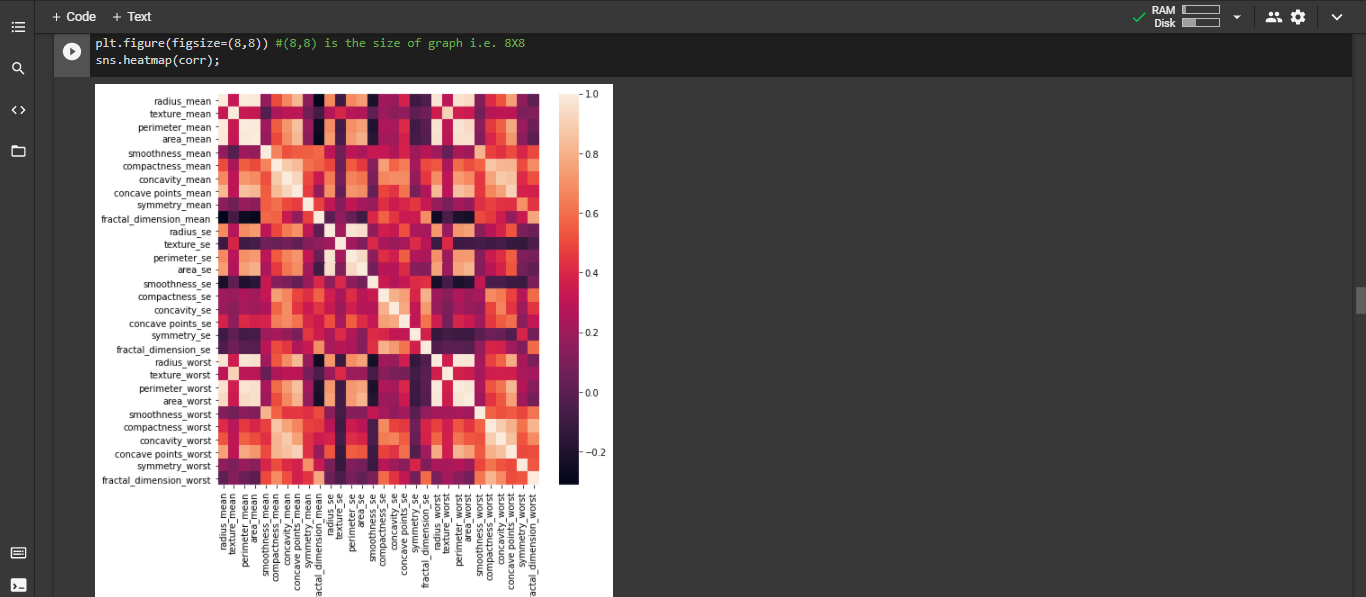
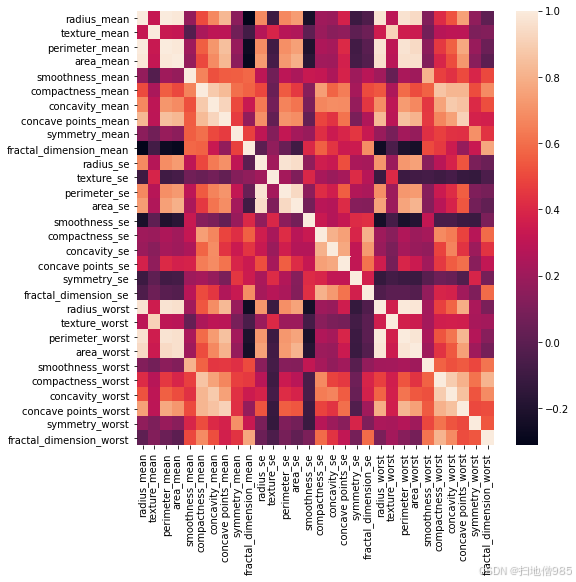
图 II:这是定义数据集中给定的不同变量/因素之间相关性的热图。
特征
该项目的特点如下:
- 使每行代码与解释保持一致
- 通过代码注释获得其他知识
- 每行说明
- 基本图形(Countplot 和 Heatmap)
- 同一项目中有 4 种不同的机器学习模型
选择这个项目的原因:
选择这个项目的一些原因如下:
- 癌症是值得研究的话题,因为它是全球最常见的疾病之一
- 研究同一项目中的不同模型
1. 导入库
导入 requirements.txt 文件中
给出的所需元器件库所需的元器件库也列在 Libraries Used (使用的元器件库) 下方
:
- Numpy
- 熊猫
- 海生
- 马特普洛特库
- Scikit-学习
2. 导入数据集
从 kaggle 或 ML datasets 文件夹中
提供的 Dataset 导入数据集Kaggle数据集
3. 数据预处理
删除数据集中不需要的列:'Unnamed: 32','id'。
将列分类为 mean、se 和 worst。
4. 数据可视化
(数据图如上所示)
创建所需的 countplot 和 heatmap 以可视化数据:
- 计数图:用于检查 Malignant 和 Benign Cancer 的值。
- Heatmap:用于根据图表中颜色的强度可视化数据。
热图定义了数据集中给定的不同变量/因素之间的相关性。
5. 模型构建和预测
我们想使用不同的其他因素找出癌症的类型。
命名:恶性癌症 == 1 和良性癌症 == 0
为了预测“诊断”列,我们使用了其他列/因子。
测试训练拆分如下: 训练(398 行) : 测试(171 行) :: 70 : 30
使用准确率分数来预测给定预测的模型准确性。
使用不同机器学习模型的结果:
- Logistic 回归:通过分析一个或多个现有自变量之间的关系来预测依赖关系。
- 决策树分类器:通过学习从先前数据(训练数据)推断的简单决策规则来预测目标变量的类别或值。
- 随机森林分类器:元估计器,在数据集的各个子样本上拟合多个决策树分类器,并使用平均来提高预测准确性和控制过拟合。
- 支持向量分类器:预测分析数据分类算法,用于将新数据元素分配给其中一个标记的类别。
6. 结论和结果
不同机器学习算法给出的准确率结果:
- Logistic 回归 = 0.982456
- 决策树分类器 = 0.923977
- 随机森林分类器 = 0.959064
- 支持向量分类器 = 0.964912
7. 实现代码
import warnings
warnings.filterwarnings('ignore') #ignore the warnings due to time lack or timeline
In [18]:
import numpy as np
import pandas as pd
import matplotlib.pyplot as plt
import seaborn as sns #use to plot functions as graphs
In [19]:
df = pd.read_csv('https://raw.githubusercontent.com/Aneeshcoder/ML-Breast-Cancer-Prediction/main/data.csv') #reading raw data
In [20]:
df.head() #checking data with their heads or titles & df is data frame
Out[20]:
| id | diagnosis | radius_mean | texture_mean | perimeter_mean | area_mean | smoothness_mean | compactness_mean | concavity_mean | concave points_mean | symmetry_mean | fractal_dimension_mean | radius_se | texture_se | perimeter_se | area_se | smoothness_se | compactness_se | concavity_se | concave points_se | symmetry_se | fractal_dimension_se | radius_worst | texture_worst | perimeter_worst | area_worst | smoothness_worst | compactness_worst | concavity_worst | concave points_worst | symmetry_worst | fractal_dimension_worst | Unnamed: 32 | |
|---|---|---|---|---|---|---|---|---|---|---|---|---|---|---|---|---|---|---|---|---|---|---|---|---|---|---|---|---|---|---|---|---|---|
| 0 | 842302 | M | 17.99 | 10.38 | 122.80 | 1001.0 | 0.11840 | 0.27760 | 0.3001 | 0.14710 | 0.2419 | 0.07871 | 1.0950 | 0.9053 | 8.589 | 153.40 | 0.006399 | 0.04904 | 0.05373 | 0.01587 | 0.03003 | 0.006193 | 25.38 | 17.33 | 184.60 | 2019.0 | 0.1622 | 0.6656 | 0.7119 | 0.2654 | 0.4601 | 0.11890 | NaN |
| 1 | 842517 | M | 20.57 | 17.77 | 132.90 | 1326.0 | 0.08474 | 0.07864 | 0.0869 | 0.07017 | 0.1812 | 0.05667 | 0.5435 | 0.7339 | 3.398 | 74.08 | 0.005225 | 0.01308 | 0.01860 | 0.01340 | 0.01389 | 0.003532 | 24.99 | 23.41 | 158.80 | 1956.0 | 0.1238 | 0.1866 | 0.2416 | 0.1860 | 0.2750 | 0.08902 | NaN |
| 2 | 84300903 | M | 19.69 | 21.25 | 130.00 | 1203.0 | 0.10960 | 0.15990 | 0.1974 | 0.12790 | 0.2069 | 0.05999 | 0.7456 | 0.7869 | 4.585 | 94.03 | 0.006150 | 0.04006 | 0.03832 | 0.02058 | 0.02250 | 0.004571 | 23.57 | 25.53 | 152.50 | 1709.0 | 0.1444 | 0.4245 | 0.4504 | 0.2430 | 0.3613 | 0.08758 | NaN |
| 3 | 84348301 | M | 11.42 | 20.38 | 77.58 | 386.1 | 0.14250 | 0.28390 | 0.2414 | 0.10520 | 0.2597 | 0.09744 | 0.4956 | 1.1560 | 3.445 | 27.23 | 0.009110 | 0.07458 | 0.05661 | 0.01867 | 0.05963 | 0.009208 | 14.91 | 26.50 | 98.87 | 567.7 | 0.2098 | 0.8663 | 0.6869 | 0.2575 | 0.6638 | 0.17300 | NaN |
| 4 | 84358402 | M | 20.29 | 14.34 | 135.10 | 1297.0 | 0.10030 | 0.13280 | 0.1980 | 0.10430 | 0.1809 | 0.05883 | 0.7572 | 0.7813 | 5.438 | 94.44 | 0.011490 | 0.02461 | 0.05688 | 0.01885 | 0.01756 | 0.005115 | 22.54 | 16.67 | 152.20 | 1575.0 | 0.1374 | 0.2050 | 0.4000 | 0.1625 | 0.2364 | 0.07678 | NaN |
In [21]:
df.columns #name of the columns
Out[21]:
Index(['id', 'diagnosis', 'radius_mean', 'texture_mean', 'perimeter_mean',
       'area_mean', 'smoothness_mean', 'compactness_mean', 'concavity_mean',
       'concave points_mean', 'symmetry_mean', 'fractal_dimension_mean',
       'radius_se', 'texture_se', 'perimeter_se', 'area_se', 'smoothness_se',
       'compactness_se', 'concavity_se', 'concave points_se', 'symmetry_se',
       'fractal_dimension_se', 'radius_worst', 'texture_worst',
       'perimeter_worst', 'area_worst', 'smoothness_worst',
       'compactness_worst', 'concavity_worst', 'concave points_worst',
       'symmetry_worst', 'fractal_dimension_worst', 'Unnamed: 32'],
      dtype='object')
In [22]:
df.info() #checking data types
<class 'pandas.core.frame.DataFrame'>
RangeIndex: 569 entries, 0 to 568
Data columns (total 33 columns):
 #   Column                   Non-Null Count  Dtype
---  ------                   --------------  -----
 0   id                       569 non-null    int64
 1   diagnosis                569 non-null    object
 2   radius_mean              569 non-null    float64
 3   texture_mean             569 non-null    float64
 4   perimeter_mean           569 non-null    float64
 5   area_mean                569 non-null    float64
 6   smoothness_mean          569 non-null    float64
 7   compactness_mean         569 non-null    float64
 8   concavity_mean           569 non-null    float64
 9   concave points_mean      569 non-null    float64
 10  symmetry_mean            569 non-null    float64
 11  fractal_dimension_mean   569 non-null    float64
 12  radius_se                569 non-null    float64
 13  texture_se               569 non-null    float64
 14  perimeter_se             569 non-null    float64
 15  area_se                  569 non-null    float64
 16  smoothness_se            569 non-null    float64
 17  compactness_se           569 non-null    float64
 18  concavity_se             569 non-null    float64
 19  concave points_se        569 non-null    float64
 20  symmetry_se              569 non-null    float64
 21  fractal_dimension_se     569 non-null    float64
 22  radius_worst             569 non-null    float64
 23  texture_worst            569 non-null    float64
 24  perimeter_worst          569 non-null    float64
 25  area_worst               569 non-null    float64
 26  smoothness_worst         569 non-null    float64
 27  compactness_worst        569 non-null    float64
 28  concavity_worst          569 non-null    float64
 29  concave points_worst     569 non-null    float64
 30  symmetry_worst           569 non-null    float64
 31  fractal_dimension_worst  569 non-null    float64
 32  Unnamed: 32              0 non-null      float64
dtypes: float64(31), int64(1), object(1)
memory usage: 146.8+ KB
In [23]:
#drop column axis=1 and row axis=0
#we need to drop unnamed column
df['Unnamed: 32']
Out[23]:
0     NaN
1     NaN
2     NaN
3     NaN
4     NaN
       ..
564   NaN
565   NaN
566   NaN
567   NaN
568   NaN
Name: Unnamed: 32, Length: 569, dtype: float64
In [24]:
df = df.drop("Unnamed: 32", axis=1)
In [25]:
df.head()
Out[25]:
| id | diagnosis | radius_mean | texture_mean | perimeter_mean | area_mean | smoothness_mean | compactness_mean | concavity_mean | concave points_mean | symmetry_mean | fractal_dimension_mean | radius_se | texture_se | perimeter_se | area_se | smoothness_se | compactness_se | concavity_se | concave points_se | symmetry_se | fractal_dimension_se | radius_worst | texture_worst | perimeter_worst | area_worst | smoothness_worst | compactness_worst | concavity_worst | concave points_worst | symmetry_worst | fractal_dimension_worst | |
|---|---|---|---|---|---|---|---|---|---|---|---|---|---|---|---|---|---|---|---|---|---|---|---|---|---|---|---|---|---|---|---|---|
| 0 | 842302 | M | 17.99 | 10.38 | 122.80 | 1001.0 | 0.11840 | 0.27760 | 0.3001 | 0.14710 | 0.2419 | 0.07871 | 1.0950 | 0.9053 | 8.589 | 153.40 | 0.006399 | 0.04904 | 0.05373 | 0.01587 | 0.03003 | 0.006193 | 25.38 | 17.33 | 184.60 | 2019.0 | 0.1622 | 0.6656 | 0.7119 | 0.2654 | 0.4601 | 0.11890 |
| 1 | 842517 | M | 20.57 | 17.77 | 132.90 | 1326.0 | 0.08474 | 0.07864 | 0.0869 | 0.07017 | 0.1812 | 0.05667 | 0.5435 | 0.7339 | 3.398 | 74.08 | 0.005225 | 0.01308 | 0.01860 | 0.01340 | 0.01389 | 0.003532 | 24.99 | 23.41 | 158.80 | 1956.0 | 0.1238 | 0.1866 | 0.2416 | 0.1860 | 0.2750 | 0.08902 |
| 2 | 84300903 | M | 19.69 | 21.25 | 130.00 | 1203.0 | 0.10960 | 0.15990 | 0.1974 | 0.12790 | 0.2069 | 0.05999 | 0.7456 | 0.7869 | 4.585 | 94.03 | 0.006150 | 0.04006 | 0.03832 | 0.02058 | 0.02250 | 0.004571 | 23.57 | 25.53 | 152.50 | 1709.0 | 0.1444 | 0.4245 | 0.4504 | 0.2430 | 0.3613 | 0.08758 |
| 3 | 84348301 | M | 11.42 | 20.38 | 77.58 | 386.1 | 0.14250 | 0.28390 | 0.2414 | 0.10520 | 0.2597 | 0.09744 | 0.4956 | 1.1560 | 3.445 | 27.23 | 0.009110 | 0.07458 | 0.05661 | 0.01867 | 0.05963 | 0.009208 | 14.91 | 26.50 | 98.87 | 567.7 | 0.2098 | 0.8663 | 0.6869 | 0.2575 | 0.6638 | 0.17300 |
| 4 | 84358402 | M | 20.29 | 14.34 | 135.10 | 1297.0 | 0.10030 | 0.13280 | 0.1980 | 0.10430 | 0.1809 | 0.05883 | 0.7572 | 0.7813 | 5.438 | 94.44 | 0.011490 | 0.02461 | 0.05688 | 0.01885 | 0.01756 | 0.005115 | 22.54 | 16.67 | 152.20 | 1575.0 | 0.1374 | 0.2050 | 0.4000 | 0.1625 | 0.2364 | 0.07678 |
In [26]:
df.columns
Out[26]:
Index(['id', 'diagnosis', 'radius_mean', 'texture_mean', 'perimeter_mean',
       'area_mean', 'smoothness_mean', 'compactness_mean', 'concavity_mean',
       'concave points_mean', 'symmetry_mean', 'fractal_dimension_mean',
       'radius_se', 'texture_se', 'perimeter_se', 'area_se', 'smoothness_se',
       'compactness_se', 'concavity_se', 'concave points_se', 'symmetry_se',
       'fractal_dimension_se', 'radius_worst', 'texture_worst',
       'perimeter_worst', 'area_worst', 'smoothness_worst',
       'compactness_worst', 'concavity_worst', 'concave points_worst',
       'symmetry_worst', 'fractal_dimension_worst'],
      dtype='object')
In [27]:
#id column not providing any useful data
df.drop("id",axis=1, inplace=True)
# df=df.drop('id',axis=1) ,we can also use this
In [28]:
df.columns
Out[28]:
Index(['diagnosis', 'radius_mean', 'texture_mean', 'perimeter_mean',
       'area_mean', 'smoothness_mean', 'compactness_mean', 'concavity_mean',
       'concave points_mean', 'symmetry_mean', 'fractal_dimension_mean',
       'radius_se', 'texture_se', 'perimeter_se', 'area_se', 'smoothness_se',
       'compactness_se', 'concavity_se', 'concave points_se', 'symmetry_se',
       'fractal_dimension_se', 'radius_worst', 'texture_worst',
       'perimeter_worst', 'area_worst', 'smoothness_worst',
       'compactness_worst', 'concavity_worst', 'concave points_worst',
       'symmetry_worst', 'fractal_dimension_worst'],
      dtype='object')
In [29]:
type(df.columns) #data type of df
Out[29]:
pandas.core.indexes.base.Index
In [30]:
l = list(df.columns) #convert columns into list
print(l)
['diagnosis', 'radius_mean', 'texture_mean', 'perimeter_mean', 'area_mean', 'smoothness_mean', 'compactness_mean', 'concavity_mean', 'concave points_mean', 'symmetry_mean', 'fractal_dimension_mean', 'radius_se', 'texture_se', 'perimeter_se', 'area_se', 'smoothness_se', 'compactness_se', 'concavity_se', 'concave points_se', 'symmetry_se', 'fractal_dimension_se', 'radius_worst', 'texture_worst', 'perimeter_worst', 'area_worst', 'smoothness_worst', 'compactness_worst', 'concavity_worst', 'concave points_worst', 'symmetry_worst', 'fractal_dimension_worst']
In [31]:
#now we can use index location that is 0,1,2,....
features_mean = l[1:11] #in python start index is inclusive and end index is exclusive

features_se = l[11:21]

features_worst = l[21:] #feature is known as column in ML
In [32]:
print(features_mean)
['radius_mean', 'texture_mean', 'perimeter_mean', 'area_mean', 'smoothness_mean', 'compactness_mean', 'concavity_mean', 'concave points_mean', 'symmetry_mean', 'fractal_dimension_mean']
In [33]:
print(features_se)
['radius_se', 'texture_se', 'perimeter_se', 'area_se', 'smoothness_se', 'compactness_se', 'concavity_se', 'concave points_se', 'symmetry_se', 'fractal_dimension_se']
In [34]:
print(features_worst)
['radius_worst', 'texture_worst', 'perimeter_worst', 'area_worst', 'smoothness_worst', 'compactness_worst', 'concavity_worst', 'concave points_worst', 'symmetry_worst', 'fractal_dimension_worst']
In [35]:
df.head(2)
Out[35]:
| diagnosis | radius_mean | texture_mean | perimeter_mean | area_mean | smoothness_mean | compactness_mean | concavity_mean | concave points_mean | symmetry_mean | fractal_dimension_mean | radius_se | texture_se | perimeter_se | area_se | smoothness_se | compactness_se | concavity_se | concave points_se | symmetry_se | fractal_dimension_se | radius_worst | texture_worst | perimeter_worst | area_worst | smoothness_worst | compactness_worst | concavity_worst | concave points_worst | symmetry_worst | fractal_dimension_worst | |
|---|---|---|---|---|---|---|---|---|---|---|---|---|---|---|---|---|---|---|---|---|---|---|---|---|---|---|---|---|---|---|---|
| 0 | M | 17.99 | 10.38 | 122.8 | 1001.0 | 0.11840 | 0.27760 | 0.3001 | 0.14710 | 0.2419 | 0.07871 | 1.0950 | 0.9053 | 8.589 | 153.40 | 0.006399 | 0.04904 | 0.05373 | 0.01587 | 0.03003 | 0.006193 | 25.38 | 17.33 | 184.6 | 2019.0 | 0.1622 | 0.6656 | 0.7119 | 0.2654 | 0.4601 | 0.11890 |
| 1 | M | 20.57 | 17.77 | 132.9 | 1326.0 | 0.08474 | 0.07864 | 0.0869 | 0.07017 | 0.1812 | 0.05667 | 0.5435 | 0.7339 | 3.398 | 74.08 | 0.005225 | 0.01308 | 0.01860 | 0.01340 | 0.01389 | 0.003532 | 24.99 | 23.41 | 158.8 | 1956.0 | 0.1238 | 0.1866 | 0.2416 | 0.1860 | 0.2750 | 0.08902 |
In [36]:
df['diagnosis'].unique()
# M = Malignant cancer and B = Benign cancer
Out[36]:
array(['M', 'B'], dtype=object)
In [37]:
sns.countplot(df['diagnosis'], label="count",);
In [38]:
df['diagnosis'].value_counts()
#value count function tells us about values of M and B in data set
Out[38]:
B    357
M    212
Name: diagnosis, dtype: int64
In [39]:
df.shape #569 no. of rows and 31 no. of columns
Out[39]:
(569, 31)
In [40]:
#Explore the Data
In [41]:
df.describe()
#summary of all the numeric columns
#std is standard deviation
Out[41]:
| radius_mean | texture_mean | perimeter_mean | area_mean | smoothness_mean | compactness_mean | concavity_mean | concave points_mean | symmetry_mean | fractal_dimension_mean | radius_se | texture_se | perimeter_se | area_se | smoothness_se | compactness_se | concavity_se | concave points_se | symmetry_se | fractal_dimension_se | radius_worst | texture_worst | perimeter_worst | area_worst | smoothness_worst | compactness_worst | concavity_worst | concave points_worst | symmetry_worst | fractal_dimension_worst | |
|---|---|---|---|---|---|---|---|---|---|---|---|---|---|---|---|---|---|---|---|---|---|---|---|---|---|---|---|---|---|---|
| count | 569.000000 | 569.000000 | 569.000000 | 569.000000 | 569.000000 | 569.000000 | 569.000000 | 569.000000 | 569.000000 | 569.000000 | 569.000000 | 569.000000 | 569.000000 | 569.000000 | 569.000000 | 569.000000 | 569.000000 | 569.000000 | 569.000000 | 569.000000 | 569.000000 | 569.000000 | 569.000000 | 569.000000 | 569.000000 | 569.000000 | 569.000000 | 569.000000 | 569.000000 | 569.000000 |
| mean | 14.127292 | 19.289649 | 91.969033 | 654.889104 | 0.096360 | 0.104341 | 0.088799 | 0.048919 | 0.181162 | 0.062798 | 0.405172 | 1.216853 | 2.866059 | 40.337079 | 0.007041 | 0.025478 | 0.031894 | 0.011796 | 0.020542 | 0.003795 | 16.269190 | 25.677223 | 107.261213 | 880.583128 | 0.132369 | 0.254265 | 0.272188 | 0.114606 | 0.290076 | 0.083946 |
| std | 3.524049 | 4.301036 | 24.298981 | 351.914129 | 0.014064 | 0.052813 | 0.079720 | 0.038803 | 0.027414 | 0.007060 | 0.277313 | 0.551648 | 2.021855 | 45.491006 | 0.003003 | 0.017908 | 0.030186 | 0.006170 | 0.008266 | 0.002646 | 4.833242 | 6.146258 | 33.602542 | 569.356993 | 0.022832 | 0.157336 | 0.208624 | 0.065732 | 0.061867 | 0.018061 |
| min | 6.981000 | 9.710000 | 43.790000 | 143.500000 | 0.052630 | 0.019380 | 0.000000 | 0.000000 | 0.106000 | 0.049960 | 0.111500 | 0.360200 | 0.757000 | 6.802000 | 0.001713 | 0.002252 | 0.000000 | 0.000000 | 0.007882 | 0.000895 | 7.930000 | 12.020000 | 50.410000 | 185.200000 | 0.071170 | 0.027290 | 0.000000 | 0.000000 | 0.156500 | 0.055040 |
| 25% | 11.700000 | 16.170000 | 75.170000 | 420.300000 | 0.086370 | 0.064920 | 0.029560 | 0.020310 | 0.161900 | 0.057700 | 0.232400 | 0.833900 | 1.606000 | 17.850000 | 0.005169 | 0.013080 | 0.015090 | 0.007638 | 0.015160 | 0.002248 | 13.010000 | 21.080000 | 84.110000 | 515.300000 | 0.116600 | 0.147200 | 0.114500 | 0.064930 | 0.250400 | 0.071460 |
| 50% | 13.370000 | 18.840000 | 86.240000 | 551.100000 | 0.095870 | 0.092630 | 0.061540 | 0.033500 | 0.179200 | 0.061540 | 0.324200 | 1.108000 | 2.287000 | 24.530000 | 0.006380 | 0.020450 | 0.025890 | 0.010930 | 0.018730 | 0.003187 | 14.970000 | 25.410000 | 97.660000 | 686.500000 | 0.131300 | 0.211900 | 0.226700 | 0.099930 | 0.282200 | 0.080040 |
| 75% | 15.780000 | 21.800000 | 104.100000 | 782.700000 | 0.105300 | 0.130400 | 0.130700 | 0.074000 | 0.195700 | 0.066120 | 0.478900 | 1.474000 | 3.357000 | 45.190000 | 0.008146 | 0.032450 | 0.042050 | 0.014710 | 0.023480 | 0.004558 | 18.790000 | 29.720000 | 125.400000 | 1084.000000 | 0.146000 | 0.339100 | 0.382900 | 0.161400 | 0.317900 | 0.092080 |
| max | 28.110000 | 39.280000 | 188.500000 | 2501.000000 | 0.163400 | 0.345400 | 0.426800 | 0.201200 | 0.304000 | 0.097440 | 2.873000 | 4.885000 | 21.980000 | 542.200000 | 0.031130 | 0.135400 | 0.396000 | 0.052790 | 0.078950 | 0.029840 | 36.040000 | 49.540000 | 251.200000 | 4254.000000 | 0.222600 | 1.058000 | 1.252000 | 0.291000 | 0.663800 | 0.207500 |
In [42]:
#Create Correlation Plot  ,, Correlation values[-1,1]
# +ve correlation = if 1st variable increase then 2nd variable also increases
# -ve correlation = if 1st variable increase then 2nd variable decreases
# no correlation = zero or nothing
In [43]:
len(df.columns)
Out[43]:
31
In [44]:
#correlation plot
corr = df.corr()
corr
Out[44]:
| radius_mean | texture_mean | perimeter_mean | area_mean | smoothness_mean | compactness_mean | concavity_mean | concave points_mean | symmetry_mean | fractal_dimension_mean | radius_se | texture_se | perimeter_se | area_se | smoothness_se | compactness_se | concavity_se | concave points_se | symmetry_se | fractal_dimension_se | radius_worst | texture_worst | perimeter_worst | area_worst | smoothness_worst | compactness_worst | concavity_worst | concave points_worst | symmetry_worst | fractal_dimension_worst | |
|---|---|---|---|---|---|---|---|---|---|---|---|---|---|---|---|---|---|---|---|---|---|---|---|---|---|---|---|---|---|---|
| radius_mean | 1.000000 | 0.323782 | 0.997855 | 0.987357 | 0.170581 | 0.506124 | 0.676764 | 0.822529 | 0.147741 | -0.311631 | 0.679090 | -0.097317 | 0.674172 | 0.735864 | -0.222600 | 0.206000 | 0.194204 | 0.376169 | -0.104321 | -0.042641 | 0.969539 | 0.297008 | 0.965137 | 0.941082 | 0.119616 | 0.413463 | 0.526911 | 0.744214 | 0.163953 | 0.007066 |
| texture_mean | 0.323782 | 1.000000 | 0.329533 | 0.321086 | -0.023389 | 0.236702 | 0.302418 | 0.293464 | 0.071401 | -0.076437 | 0.275869 | 0.386358 | 0.281673 | 0.259845 | 0.006614 | 0.191975 | 0.143293 | 0.163851 | 0.009127 | 0.054458 | 0.352573 | 0.912045 | 0.358040 | 0.343546 | 0.077503 | 0.277830 | 0.301025 | 0.295316 | 0.105008 | 0.119205 |
| perimeter_mean | 0.997855 | 0.329533 | 1.000000 | 0.986507 | 0.207278 | 0.556936 | 0.716136 | 0.850977 | 0.183027 | -0.261477 | 0.691765 | -0.086761 | 0.693135 | 0.744983 | -0.202694 | 0.250744 | 0.228082 | 0.407217 | -0.081629 | -0.005523 | 0.969476 | 0.303038 | 0.970387 | 0.941550 | 0.150549 | 0.455774 | 0.563879 | 0.771241 | 0.189115 | 0.051019 |
| area_mean | 0.987357 | 0.321086 | 0.986507 | 1.000000 | 0.177028 | 0.498502 | 0.685983 | 0.823269 | 0.151293 | -0.283110 | 0.732562 | -0.066280 | 0.726628 | 0.800086 | -0.166777 | 0.212583 | 0.207660 | 0.372320 | -0.072497 | -0.019887 | 0.962746 | 0.287489 | 0.959120 | 0.959213 | 0.123523 | 0.390410 | 0.512606 | 0.722017 | 0.143570 | 0.003738 |
| smoothness_mean | 0.170581 | -0.023389 | 0.207278 | 0.177028 | 1.000000 | 0.659123 | 0.521984 | 0.553695 | 0.557775 | 0.584792 | 0.301467 | 0.068406 | 0.296092 | 0.246552 | 0.332375 | 0.318943 | 0.248396 | 0.380676 | 0.200774 | 0.283607 | 0.213120 | 0.036072 | 0.238853 | 0.206718 | 0.805324 | 0.472468 | 0.434926 | 0.503053 | 0.394309 | 0.499316 |
| compactness_mean | 0.506124 | 0.236702 | 0.556936 | 0.498502 | 0.659123 | 1.000000 | 0.883121 | 0.831135 | 0.602641 | 0.565369 | 0.497473 | 0.046205 | 0.548905 | 0.455653 | 0.135299 | 0.738722 | 0.570517 | 0.642262 | 0.229977 | 0.507318 | 0.535315 | 0.248133 | 0.590210 | 0.509604 | 0.565541 | 0.865809 | 0.816275 | 0.815573 | 0.510223 | 0.687382 |
| concavity_mean | 0.676764 | 0.302418 | 0.716136 | 0.685983 | 0.521984 | 0.883121 | 1.000000 | 0.921391 | 0.500667 | 0.336783 | 0.631925 | 0.076218 | 0.660391 | 0.617427 | 0.098564 | 0.670279 | 0.691270 | 0.683260 | 0.178009 | 0.449301 | 0.688236 | 0.299879 | 0.729565 | 0.675987 | 0.448822 | 0.754968 | 0.884103 | 0.861323 | 0.409464 | 0.514930 |
| concave points_mean | 0.822529 | 0.293464 | 0.850977 | 0.823269 | 0.553695 | 0.831135 | 0.921391 | 1.000000 | 0.462497 | 0.166917 | 0.698050 | 0.021480 | 0.710650 | 0.690299 | 0.027653 | 0.490424 | 0.439167 | 0.615634 | 0.095351 | 0.257584 | 0.830318 | 0.292752 | 0.855923 | 0.809630 | 0.452753 | 0.667454 | 0.752399 | 0.910155 | 0.375744 | 0.368661 |
| symmetry_mean | 0.147741 | 0.071401 | 0.183027 | 0.151293 | 0.557775 | 0.602641 | 0.500667 | 0.462497 | 1.000000 | 0.479921 | 0.303379 | 0.128053 | 0.313893 | 0.223970 | 0.187321 | 0.421659 | 0.342627 | 0.393298 | 0.449137 | 0.331786 | 0.185728 | 0.090651 | 0.219169 | 0.177193 | 0.426675 | 0.473200 | 0.433721 | 0.430297 | 0.699826 | 0.438413 |
| fractal_dimension_mean | -0.311631 | -0.076437 | -0.261477 | -0.283110 | 0.584792 | 0.565369 | 0.336783 | 0.166917 | 0.479921 | 1.000000 | 0.000111 | 0.164174 | 0.039830 | -0.090170 | 0.401964 | 0.559837 | 0.446630 | 0.341198 | 0.345007 | 0.688132 | -0.253691 | -0.051269 | -0.205151 | -0.231854 | 0.504942 | 0.458798 | 0.346234 | 0.175325 | 0.334019 | 0.767297 |
| radius_se | 0.679090 | 0.275869 | 0.691765 | 0.732562 | 0.301467 | 0.497473 | 0.631925 | 0.698050 | 0.303379 | 0.000111 | 1.000000 | 0.213247 | 0.972794 | 0.951830 | 0.164514 | 0.356065 | 0.332358 | 0.513346 | 0.240567 | 0.227754 | 0.715065 | 0.194799 | 0.719684 | 0.751548 | 0.141919 | 0.287103 | 0.380585 | 0.531062 | 0.094543 | 0.049559 |
| texture_se | -0.097317 | 0.386358 | -0.086761 | -0.066280 | 0.068406 | 0.046205 | 0.076218 | 0.021480 | 0.128053 | 0.164174 | 0.213247 | 1.000000 | 0.223171 | 0.111567 | 0.397243 | 0.231700 | 0.194998 | 0.230283 | 0.411621 | 0.279723 | -0.111690 | 0.409003 | -0.102242 | -0.083195 | -0.073658 | -0.092439 | -0.068956 | -0.119638 | -0.128215 | -0.045655 |
| perimeter_se | 0.674172 | 0.281673 | 0.693135 | 0.726628 | 0.296092 | 0.548905 | 0.660391 | 0.710650 | 0.313893 | 0.039830 | 0.972794 | 0.223171 | 1.000000 | 0.937655 | 0.151075 | 0.416322 | 0.362482 | 0.556264 | 0.266487 | 0.244143 | 0.697201 | 0.200371 | 0.721031 | 0.730713 | 0.130054 | 0.341919 | 0.418899 | 0.554897 | 0.109930 | 0.085433 |
| area_se | 0.735864 | 0.259845 | 0.744983 | 0.800086 | 0.246552 | 0.455653 | 0.617427 | 0.690299 | 0.223970 | -0.090170 | 0.951830 | 0.111567 | 0.937655 | 1.000000 | 0.075150 | 0.284840 | 0.270895 | 0.415730 | 0.134109 | 0.127071 | 0.757373 | 0.196497 | 0.761213 | 0.811408 | 0.125389 | 0.283257 | 0.385100 | 0.538166 | 0.074126 | 0.017539 |
| smoothness_se | -0.222600 | 0.006614 | -0.202694 | -0.166777 | 0.332375 | 0.135299 | 0.098564 | 0.027653 | 0.187321 | 0.401964 | 0.164514 | 0.397243 | 0.151075 | 0.075150 | 1.000000 | 0.336696 | 0.268685 | 0.328429 | 0.413506 | 0.427374 | -0.230691 | -0.074743 | -0.217304 | -0.182195 | 0.314457 | -0.055558 | -0.058298 | -0.102007 | -0.107342 | 0.101480 |
| compactness_se | 0.206000 | 0.191975 | 0.250744 | 0.212583 | 0.318943 | 0.738722 | 0.670279 | 0.490424 | 0.421659 | 0.559837 | 0.356065 | 0.231700 | 0.416322 | 0.284840 | 0.336696 | 1.000000 | 0.801268 | 0.744083 | 0.394713 | 0.803269 | 0.204607 | 0.143003 | 0.260516 | 0.199371 | 0.227394 | 0.678780 | 0.639147 | 0.483208 | 0.277878 | 0.590973 |
| concavity_se | 0.194204 | 0.143293 | 0.228082 | 0.207660 | 0.248396 | 0.570517 | 0.691270 | 0.439167 | 0.342627 | 0.446630 | 0.332358 | 0.194998 | 0.362482 | 0.270895 | 0.268685 | 0.801268 | 1.000000 | 0.771804 | 0.309429 | 0.727372 | 0.186904 | 0.100241 | 0.226680 | 0.188353 | 0.168481 | 0.484858 | 0.662564 | 0.440472 | 0.197788 | 0.439329 |
| concave points_se | 0.376169 | 0.163851 | 0.407217 | 0.372320 | 0.380676 | 0.642262 | 0.683260 | 0.615634 | 0.393298 | 0.341198 | 0.513346 | 0.230283 | 0.556264 | 0.415730 | 0.328429 | 0.744083 | 0.771804 | 1.000000 | 0.312780 | 0.611044 | 0.358127 | 0.086741 | 0.394999 | 0.342271 | 0.215351 | 0.452888 | 0.549592 | 0.602450 | 0.143116 | 0.310655 |
| symmetry_se | -0.104321 | 0.009127 | -0.081629 | -0.072497 | 0.200774 | 0.229977 | 0.178009 | 0.095351 | 0.449137 | 0.345007 | 0.240567 | 0.411621 | 0.266487 | 0.134109 | 0.413506 | 0.394713 | 0.309429 | 0.312780 | 1.000000 | 0.369078 | -0.128121 | -0.077473 | -0.103753 | -0.110343 | -0.012662 | 0.060255 | 0.037119 | -0.030413 | 0.389402 | 0.078079 |
| fractal_dimension_se | -0.042641 | 0.054458 | -0.005523 | -0.019887 | 0.283607 | 0.507318 | 0.449301 | 0.257584 | 0.331786 | 0.688132 | 0.227754 | 0.279723 | 0.244143 | 0.127071 | 0.427374 | 0.803269 | 0.727372 | 0.611044 | 0.369078 | 1.000000 | -0.037488 | -0.003195 | -0.001000 | -0.022736 | 0.170568 | 0.390159 | 0.379975 | 0.215204 | 0.111094 | 0.591328 |
| radius_worst | 0.969539 | 0.352573 | 0.969476 | 0.962746 | 0.213120 | 0.535315 | 0.688236 | 0.830318 | 0.185728 | -0.253691 | 0.715065 | -0.111690 | 0.697201 | 0.757373 | -0.230691 | 0.204607 | 0.186904 | 0.358127 | -0.128121 | -0.037488 | 1.000000 | 0.359921 | 0.993708 | 0.984015 | 0.216574 | 0.475820 | 0.573975 | 0.787424 | 0.243529 | 0.093492 |
| texture_worst | 0.297008 | 0.912045 | 0.303038 | 0.287489 | 0.036072 | 0.248133 | 0.299879 | 0.292752 | 0.090651 | -0.051269 | 0.194799 | 0.409003 | 0.200371 | 0.196497 | -0.074743 | 0.143003 | 0.100241 | 0.086741 | -0.077473 | -0.003195 | 0.359921 | 1.000000 | 0.365098 | 0.345842 | 0.225429 | 0.360832 | 0.368366 | 0.359755 | 0.233027 | 0.219122 |
| perimeter_worst | 0.965137 | 0.358040 | 0.970387 | 0.959120 | 0.238853 | 0.590210 | 0.729565 | 0.855923 | 0.219169 | -0.205151 | 0.719684 | -0.102242 | 0.721031 | 0.761213 | -0.217304 | 0.260516 | 0.226680 | 0.394999 | -0.103753 | -0.001000 | 0.993708 | 0.365098 | 1.000000 | 0.977578 | 0.236775 | 0.529408 | 0.618344 | 0.816322 | 0.269493 | 0.138957 |
| area_worst | 0.941082 | 0.343546 | 0.941550 | 0.959213 | 0.206718 | 0.509604 | 0.675987 | 0.809630 | 0.177193 | -0.231854 | 0.751548 | -0.083195 | 0.730713 | 0.811408 | -0.182195 | 0.199371 | 0.188353 | 0.342271 | -0.110343 | -0.022736 | 0.984015 | 0.345842 | 0.977578 | 1.000000 | 0.209145 | 0.438296 | 0.543331 | 0.747419 | 0.209146 | 0.079647 |
| smoothness_worst | 0.119616 | 0.077503 | 0.150549 | 0.123523 | 0.805324 | 0.565541 | 0.448822 | 0.452753 | 0.426675 | 0.504942 | 0.141919 | -0.073658 | 0.130054 | 0.125389 | 0.314457 | 0.227394 | 0.168481 | 0.215351 | -0.012662 | 0.170568 | 0.216574 | 0.225429 | 0.236775 | 0.209145 | 1.000000 | 0.568187 | 0.518523 | 0.547691 | 0.493838 | 0.617624 |
| compactness_worst | 0.413463 | 0.277830 | 0.455774 | 0.390410 | 0.472468 | 0.865809 | 0.754968 | 0.667454 | 0.473200 | 0.458798 | 0.287103 | -0.092439 | 0.341919 | 0.283257 | -0.055558 | 0.678780 | 0.484858 | 0.452888 | 0.060255 | 0.390159 | 0.475820 | 0.360832 | 0.529408 | 0.438296 | 0.568187 | 1.000000 | 0.892261 | 0.801080 | 0.614441 | 0.810455 |
| concavity_worst | 0.526911 | 0.301025 | 0.563879 | 0.512606 | 0.434926 | 0.816275 | 0.884103 | 0.752399 | 0.433721 | 0.346234 | 0.380585 | -0.068956 | 0.418899 | 0.385100 | -0.058298 | 0.639147 | 0.662564 | 0.549592 | 0.037119 | 0.379975 | 0.573975 | 0.368366 | 0.618344 | 0.543331 | 0.518523 | 0.892261 | 1.000000 | 0.855434 | 0.532520 | 0.686511 |
| concave points_worst | 0.744214 | 0.295316 | 0.771241 | 0.722017 | 0.503053 | 0.815573 | 0.861323 | 0.910155 | 0.430297 | 0.175325 | 0.531062 | -0.119638 | 0.554897 | 0.538166 | -0.102007 | 0.483208 | 0.440472 | 0.602450 | -0.030413 | 0.215204 | 0.787424 | 0.359755 | 0.816322 | 0.747419 | 0.547691 | 0.801080 | 0.855434 | 1.000000 | 0.502528 | 0.511114 |
| symmetry_worst | 0.163953 | 0.105008 | 0.189115 | 0.143570 | 0.394309 | 0.510223 | 0.409464 | 0.375744 | 0.699826 | 0.334019 | 0.094543 | -0.128215 | 0.109930 | 0.074126 | -0.107342 | 0.277878 | 0.197788 | 0.143116 | 0.389402 | 0.111094 | 0.243529 | 0.233027 | 0.269493 | 0.209146 | 0.493838 | 0.614441 | 0.532520 | 0.502528 | 1.000000 | 0.537848 |
| fractal_dimension_worst | 0.007066 | 0.119205 | 0.051019 | 0.003738 | 0.499316 | 0.687382 | 0.514930 | 0.368661 | 0.438413 | 0.767297 | 0.049559 | -0.045655 | 0.085433 | 0.017539 | 0.101480 | 0.590973 | 0.439329 | 0.310655 | 0.078079 | 0.591328 | 0.093492 | 0.219122 | 0.138957 | 0.079647 | 0.617624 | 0.810455 | 0.686511 | 0.511114 | 0.537848 | 1.000000 |
In [45]:
corr.shape
Out[45]:
(30, 30)
In [46]:
plt.figure(figsize=(8,8)) #(8,8) is the size of graph i.e. 8X8
sns.heatmap(corr);
In [47]:
df.head()
Out[47]:
| diagnosis | radius_mean | texture_mean | perimeter_mean | area_mean | smoothness_mean | compactness_mean | concavity_mean | concave points_mean | symmetry_mean | fractal_dimension_mean | radius_se | texture_se | perimeter_se | area_se | smoothness_se | compactness_se | concavity_se | concave points_se | symmetry_se | fractal_dimension_se | radius_worst | texture_worst | perimeter_worst | area_worst | smoothness_worst | compactness_worst | concavity_worst | concave points_worst | symmetry_worst | fractal_dimension_worst | |
|---|---|---|---|---|---|---|---|---|---|---|---|---|---|---|---|---|---|---|---|---|---|---|---|---|---|---|---|---|---|---|---|
| 0 | M | 17.99 | 10.38 | 122.80 | 1001.0 | 0.11840 | 0.27760 | 0.3001 | 0.14710 | 0.2419 | 0.07871 | 1.0950 | 0.9053 | 8.589 | 153.40 | 0.006399 | 0.04904 | 0.05373 | 0.01587 | 0.03003 | 0.006193 | 25.38 | 17.33 | 184.60 | 2019.0 | 0.1622 | 0.6656 | 0.7119 | 0.2654 | 0.4601 | 0.11890 |
| 1 | M | 20.57 | 17.77 | 132.90 | 1326.0 | 0.08474 | 0.07864 | 0.0869 | 0.07017 | 0.1812 | 0.05667 | 0.5435 | 0.7339 | 3.398 | 74.08 | 0.005225 | 0.01308 | 0.01860 | 0.01340 | 0.01389 | 0.003532 | 24.99 | 23.41 | 158.80 | 1956.0 | 0.1238 | 0.1866 | 0.2416 | 0.1860 | 0.2750 | 0.08902 |
| 2 | M | 19.69 | 21.25 | 130.00 | 1203.0 | 0.10960 | 0.15990 | 0.1974 | 0.12790 | 0.2069 | 0.05999 | 0.7456 | 0.7869 | 4.585 | 94.03 | 0.006150 | 0.04006 | 0.03832 | 0.02058 | 0.02250 | 0.004571 | 23.57 | 25.53 | 152.50 | 1709.0 | 0.1444 | 0.4245 | 0.4504 | 0.2430 | 0.3613 | 0.08758 |
| 3 | M | 11.42 | 20.38 | 77.58 | 386.1 | 0.14250 | 0.28390 | 0.2414 | 0.10520 | 0.2597 | 0.09744 | 0.4956 | 1.1560 | 3.445 | 27.23 | 0.009110 | 0.07458 | 0.05661 | 0.01867 | 0.05963 | 0.009208 | 14.91 | 26.50 | 98.87 | 567.7 | 0.2098 | 0.8663 | 0.6869 | 0.2575 | 0.6638 | 0.17300 |
| 4 | M | 20.29 | 14.34 | 135.10 | 1297.0 | 0.10030 | 0.13280 | 0.1980 | 0.10430 | 0.1809 | 0.05883 | 0.7572 | 0.7813 | 5.438 | 94.44 | 0.011490 | 0.02461 | 0.05688 | 0.01885 | 0.01756 | 0.005115 | 22.54 | 16.67 | 152.20 | 1575.0 | 0.1374 | 0.2050 | 0.4000 | 0.1625 | 0.2364 | 0.07678 |
In [48]:
#M==1 and B==0
df['diagnosis']=df['diagnosis'].map({'M':1, 'B':0})
In [49]:
df.head()
Out[49]:
| diagnosis | radius_mean | texture_mean | perimeter_mean | area_mean | smoothness_mean | compactness_mean | concavity_mean | concave points_mean | symmetry_mean | fractal_dimension_mean | radius_se | texture_se | perimeter_se | area_se | smoothness_se | compactness_se | concavity_se | concave points_se | symmetry_se | fractal_dimension_se | radius_worst | texture_worst | perimeter_worst | area_worst | smoothness_worst | compactness_worst | concavity_worst | concave points_worst | symmetry_worst | fractal_dimension_worst | |
|---|---|---|---|---|---|---|---|---|---|---|---|---|---|---|---|---|---|---|---|---|---|---|---|---|---|---|---|---|---|---|---|
| 0 | 1 | 17.99 | 10.38 | 122.80 | 1001.0 | 0.11840 | 0.27760 | 0.3001 | 0.14710 | 0.2419 | 0.07871 | 1.0950 | 0.9053 | 8.589 | 153.40 | 0.006399 | 0.04904 | 0.05373 | 0.01587 | 0.03003 | 0.006193 | 25.38 | 17.33 | 184.60 | 2019.0 | 0.1622 | 0.6656 | 0.7119 | 0.2654 | 0.4601 | 0.11890 |
| 1 | 1 | 20.57 | 17.77 | 132.90 | 1326.0 | 0.08474 | 0.07864 | 0.0869 | 0.07017 | 0.1812 | 0.05667 | 0.5435 | 0.7339 | 3.398 | 74.08 | 0.005225 | 0.01308 | 0.01860 | 0.01340 | 0.01389 | 0.003532 | 24.99 | 23.41 | 158.80 | 1956.0 | 0.1238 | 0.1866 | 0.2416 | 0.1860 | 0.2750 | 0.08902 |
| 2 | 1 | 19.69 | 21.25 | 130.00 | 1203.0 | 0.10960 | 0.15990 | 0.1974 | 0.12790 | 0.2069 | 0.05999 | 0.7456 | 0.7869 | 4.585 | 94.03 | 0.006150 | 0.04006 | 0.03832 | 0.02058 | 0.02250 | 0.004571 | 23.57 | 25.53 | 152.50 | 1709.0 | 0.1444 | 0.4245 | 0.4504 | 0.2430 | 0.3613 | 0.08758 |
| 3 | 1 | 11.42 | 20.38 | 77.58 | 386.1 | 0.14250 | 0.28390 | 0.2414 | 0.10520 | 0.2597 | 0.09744 | 0.4956 | 1.1560 | 3.445 | 27.23 | 0.009110 | 0.07458 | 0.05661 | 0.01867 | 0.05963 | 0.009208 | 14.91 | 26.50 | 98.87 | 567.7 | 0.2098 | 0.8663 | 0.6869 | 0.2575 | 0.6638 | 0.17300 |
| 4 | 1 | 20.29 | 14.34 | 135.10 | 1297.0 | 0.10030 | 0.13280 | 0.1980 | 0.10430 | 0.1809 | 0.05883 | 0.7572 | 0.7813 | 5.438 | 94.44 | 0.011490 | 0.02461 | 0.05688 | 0.01885 | 0.01756 | 0.005115 | 22.54 | 16.67 | 152.20 | 1575.0 | 0.1374 | 0.2050 | 0.4000 | 0.1625 | 0.2364 | 0.07678 |
In [50]:
df['diagnosis'].unique()
Out[50]:
array([1, 0])
In [51]:
X = df.drop('diagnosis',axis=1)  #Capital X is preferred
X.head()
Out[51]:
| radius_mean | texture_mean | perimeter_mean | area_mean | smoothness_mean | compactness_mean | concavity_mean | concave points_mean | symmetry_mean | fractal_dimension_mean | radius_se | texture_se | perimeter_se | area_se | smoothness_se | compactness_se | concavity_se | concave points_se | symmetry_se | fractal_dimension_se | radius_worst | texture_worst | perimeter_worst | area_worst | smoothness_worst | compactness_worst | concavity_worst | concave points_worst | symmetry_worst | fractal_dimension_worst | |
|---|---|---|---|---|---|---|---|---|---|---|---|---|---|---|---|---|---|---|---|---|---|---|---|---|---|---|---|---|---|---|
| 0 | 17.99 | 10.38 | 122.80 | 1001.0 | 0.11840 | 0.27760 | 0.3001 | 0.14710 | 0.2419 | 0.07871 | 1.0950 | 0.9053 | 8.589 | 153.40 | 0.006399 | 0.04904 | 0.05373 | 0.01587 | 0.03003 | 0.006193 | 25.38 | 17.33 | 184.60 | 2019.0 | 0.1622 | 0.6656 | 0.7119 | 0.2654 | 0.4601 | 0.11890 |
| 1 | 20.57 | 17.77 | 132.90 | 1326.0 | 0.08474 | 0.07864 | 0.0869 | 0.07017 | 0.1812 | 0.05667 | 0.5435 | 0.7339 | 3.398 | 74.08 | 0.005225 | 0.01308 | 0.01860 | 0.01340 | 0.01389 | 0.003532 | 24.99 | 23.41 | 158.80 | 1956.0 | 0.1238 | 0.1866 | 0.2416 | 0.1860 | 0.2750 | 0.08902 |
| 2 | 19.69 | 21.25 | 130.00 | 1203.0 | 0.10960 | 0.15990 | 0.1974 | 0.12790 | 0.2069 | 0.05999 | 0.7456 | 0.7869 | 4.585 | 94.03 | 0.006150 | 0.04006 | 0.03832 | 0.02058 | 0.02250 | 0.004571 | 23.57 | 25.53 | 152.50 | 1709.0 | 0.1444 | 0.4245 | 0.4504 | 0.2430 | 0.3613 | 0.08758 |
| 3 | 11.42 | 20.38 | 77.58 | 386.1 | 0.14250 | 0.28390 | 0.2414 | 0.10520 | 0.2597 | 0.09744 | 0.4956 | 1.1560 | 3.445 | 27.23 | 0.009110 | 0.07458 | 0.05661 | 0.01867 | 0.05963 | 0.009208 | 14.91 | 26.50 | 98.87 | 567.7 | 0.2098 | 0.8663 | 0.6869 | 0.2575 | 0.6638 | 0.17300 |
| 4 | 20.29 | 14.34 | 135.10 | 1297.0 | 0.10030 | 0.13280 | 0.1980 | 0.10430 | 0.1809 | 0.05883 | 0.7572 | 0.7813 | 5.438 | 94.44 | 0.011490 | 0.02461 | 0.05688 | 0.01885 | 0.01756 | 0.005115 | 22.54 | 16.67 | 152.20 | 1575.0 | 0.1374 | 0.2050 | 0.4000 | 0.1625 | 0.2364 | 0.07678 |
In [52]:
y = df['diagnosis']  #Small y is preferred
y.head()
Out[52]:
0    1
1    1
2    1
3    1
4    1
Name: diagnosis, dtype: int64
In [53]:
#0. fit()
#1. Study(X_train,y_train)
#2. Brain(intelligence)
#3. How good is preparation X_test
#4. y_pred i.e. predicted values
#5. Comparison of y_pred and y_test => how good is model prepared
In [54]:
from sklearn.model_selection import train_test_split
X_train, X_test, y_train, y_test = train_test_split(X, y, test_size=0.3)
In [55]:
df.shape
Out[55]:
(569, 31)
In [56]:
X_train.shape
Out[56]:
(398, 30)
In [57]:
X_test.shape
Out[57]:
(171, 30)
In [58]:
y_train.shape
Out[58]:
(398,)
In [59]:
y_test.shape
Out[59]:
(171,)
In [60]:
from sklearn.preprocessing import StandardScaler
ss = StandardScaler() #scaling near to 0
X_train = ss.fit_transform(X_train)  #fit and immediately transform
X_test = ss.transform(X_test) #dont need fit as fit is equivalent to studying
In [61]:
X_train
Out[61]:
array([[-1.14855258,  0.03289996, -1.14449945, ..., -1.41275479,
        -1.03771554, -0.87408813],
       [-0.39236814,  2.2678828 , -0.44529805, ..., -0.76228731,
        -0.8073702 , -1.00779198],
       [ 1.64440453,  0.48035079,  1.58878064, ...,  1.02200017,
         0.24586401, -0.0900031 ],
       ...,
       [-0.48508041, -0.68938108, -0.38219323, ...,  0.29315944,
         0.50162677,  0.99051064],
       [-0.56330638,  0.24413309, -0.61904665, ..., -0.62002614,
        -0.35144528, -0.80360857],
       [-0.72555286, -0.28735673, -0.65438535, ...,  0.40599253,
        -0.40545729,  0.43600239]])
In [62]:
# Machine Learning Models
In [63]:
# Logistic Regression
In [64]:
from sklearn.linear_model import LogisticRegression
lr = LogisticRegression()
lr.fit(X_train, y_train)
Out[64]:
LogisticRegression(C=1.0, class_weight=None, dual=False, fit_intercept=True,
                   intercept_scaling=1, l1_ratio=None, max_iter=100,
                   multi_class='auto', n_jobs=None, penalty='l2',
                   random_state=None, solver='lbfgs', tol=0.0001, verbose=0,
                   warm_start=False)
In [65]:
y_pred =lr.predict(X_test)
In [66]:
y_pred
Out[66]:
array([1, 1, 0, 0, 0, 0, 0, 1, 0, 0, 1, 1, 1, 1, 0, 0, 0, 1, 0, 1, 1, 0,
       0, 1, 0, 0, 1, 1, 0, 0, 0, 1, 0, 1, 1, 0, 0, 1, 1, 0, 0, 0, 1, 0,
       0, 1, 0, 0, 1, 0, 0, 0, 1, 0, 1, 0, 0, 1, 0, 1, 0, 0, 1, 1, 0, 1,
       0, 0, 0, 0, 0, 0, 0, 0, 0, 0, 0, 1, 1, 0, 0, 1, 0, 0, 0, 1, 1, 1,
       0, 0, 0, 0, 0, 0, 0, 0, 0, 1, 0, 0, 0, 0, 0, 0, 0, 1, 0, 1, 1, 0,
       0, 0, 0, 0, 1, 1, 0, 0, 0, 0, 0, 0, 0, 1, 1, 1, 0, 1, 1, 0, 1, 0,
       1, 0, 1, 1, 0, 0, 1, 1, 0, 0, 0, 0, 1, 0, 0, 0, 1, 0, 0, 1, 1, 0,
       0, 0, 0, 0, 0, 0, 0, 1, 1, 0, 0, 1, 0, 0, 1, 0, 0])
In [67]:
y_test
Out[67]:
8      1
62     1
478    0
238    0
488    0
      ..
243    0
350    0
16     1
531    0
298    0
Name: diagnosis, Length: 171, dtype: int64
In [68]:
# accuracy_score gives performance of function
In [69]:
from sklearn.metrics import accuracy_score
print(accuracy_score(y_test,y_pred))  # approx 98.245%
0.9883040935672515
In [70]:
lr_acc = accuracy_score(y_test, y_pred)
print(lr_acc)
0.9883040935672515
In [71]:
results = pd.DataFrame()
results  #empty dataframe
Out[71]:
In [72]:
tempResults = pd.DataFrame({'Algorithm':['Logistic Regression Method'], 'Accuracy':[lr_acc]}) #Headings Algorithm and Accuracy
results = pd.concat([results,tempResults])
results = results[['Algorithm','Accuracy']]
results
Out[72]:
| Algorithm | Accuracy | |
|---|---|---|
| 0 | Logistic Regression Method | 0.988304 |
In [73]:
# Decision Tree Classifier //more powerful algorithm than LR
In [74]:
from sklearn.tree import DecisionTreeClassifier
dtc = DecisionTreeClassifier()
dtc.fit(X_train, y_train)
Out[74]:
DecisionTreeClassifier(ccp_alpha=0.0, class_weight=None, criterion='gini',
                       max_depth=None, max_features=None, max_leaf_nodes=None,
                       min_impurity_decrease=0.0, min_impurity_split=None,
                       min_samples_leaf=1, min_samples_split=2,
                       min_weight_fraction_leaf=0.0, presort='deprecated',
                       random_state=None, splitter='best')
In [75]:
y_pred = dtc.predict(X_test)
y_pred
Out[75]:
array([1, 1, 0, 0, 0, 0, 0, 1, 1, 0, 1, 1, 1, 1, 0, 0, 0, 1, 0, 1, 1, 0,
       0, 1, 0, 0, 1, 1, 0, 0, 0, 1, 0, 1, 1, 0, 0, 1, 1, 1, 0, 0, 1, 0,
       0, 1, 0, 0, 1, 0, 0, 0, 1, 1, 1, 0, 0, 1, 0, 1, 0, 0, 0, 1, 0, 1,
       0, 0, 1, 0, 0, 0, 0, 0, 0, 0, 0, 1, 1, 0, 0, 1, 0, 0, 0, 1, 1, 0,
       0, 0, 0, 0, 0, 0, 0, 0, 0, 1, 0, 0, 0, 0, 0, 0, 0, 1, 0, 1, 0, 0,
       0, 0, 0, 0, 1, 1, 0, 0, 0, 0, 0, 0, 0, 1, 0, 1, 0, 1, 1, 0, 1, 0,
       1, 0, 1, 1, 0, 0, 1, 1, 0, 0, 0, 0, 1, 0, 0, 0, 1, 0, 0, 1, 1, 0,
       0, 0, 0, 0, 0, 0, 0, 1, 1, 0, 0, 0, 0, 0, 1, 0, 0])
In [76]:
from sklearn.metrics import accuracy_score
print(accuracy_score(y_test, y_pred))
0.9473684210526315
In [77]:
dtc_acc = accuracy_score(y_test, y_pred)
print(dtc_acc)
0.9473684210526315
In [78]:
tempResults = pd.DataFrame({'Algorithm':['Decision Tree Classifier Method'], 'Accuracy':[dtc_acc]}) #Headings Algorithm and Accuracy
results = pd.concat([results,tempResults])
results = results[['Algorithm','Accuracy']]
results
Out[78]:
| Algorithm | Accuracy | |
|---|---|---|
| 0 | Logistic Regression Method | 0.988304 |
| 0 | Decision Tree Classifier Method | 0.947368 |
In [79]:
# Random Forest Classifier //most powerful algorithm
In [80]:
from sklearn.ensemble import RandomForestClassifier
rfc = RandomForestClassifier()
rfc.fit(X_train, y_train)
Out[80]:
RandomForestClassifier(bootstrap=True, ccp_alpha=0.0, class_weight=None,
                       criterion='gini', max_depth=None, max_features='auto',
                       max_leaf_nodes=None, max_samples=None,
                       min_impurity_decrease=0.0, min_impurity_split=None,
                       min_samples_leaf=1, min_samples_split=2,
                       min_weight_fraction_leaf=0.0, n_estimators=100,
                       n_jobs=None, oob_score=False, random_state=None,
                       verbose=0, warm_start=False)
In [81]:
y_pred = rfc.predict(X_test)
y_pred
Out[81]:
array([1, 1, 0, 0, 0, 0, 0, 1, 0, 0, 1, 1, 1, 1, 0, 0, 0, 1, 0, 1, 1, 0,
       0, 1, 0, 0, 1, 1, 0, 0, 0, 1, 0, 1, 1, 0, 0, 1, 1, 1, 0, 0, 1, 0,
       0, 1, 0, 0, 1, 0, 0, 0, 1, 0, 1, 0, 0, 1, 0, 1, 0, 0, 1, 1, 0, 1,
       0, 0, 0, 0, 0, 0, 0, 0, 0, 0, 0, 1, 1, 0, 0, 1, 0, 0, 0, 1, 1, 1,
       0, 0, 0, 0, 0, 0, 0, 0, 0, 1, 0, 0, 0, 0, 0, 0, 0, 1, 0, 1, 0, 0,
       0, 0, 0, 0, 1, 1, 0, 0, 0, 0, 0, 0, 0, 1, 1, 1, 0, 1, 1, 0, 1, 0,
       1, 0, 1, 1, 0, 0, 1, 1, 0, 0, 0, 0, 1, 0, 0, 0, 1, 0, 0, 1, 1, 0,
       0, 0, 0, 0, 0, 0, 0, 1, 1, 0, 0, 0, 0, 0, 1, 0, 0])
In [82]:
from sklearn.metrics import accuracy_score
print(accuracy_score(y_test, y_pred))
0.9824561403508771
In [83]:
rfc_acc = accuracy_score(y_test, y_pred)
print(rfc_acc)
0.9824561403508771
In [84]:
tempResults = pd.DataFrame({'Algorithm':['Random Forest Classifier Method'], 'Accuracy':[rfc_acc]}) #Headings Algorithm and Accuracy
results = pd.concat([results,tempResults])
results = results[['Algorithm','Accuracy']]
results
Out[84]:
| Algorithm | Accuracy | |
|---|---|---|
| 0 | Logistic Regression Method | 0.988304 |
| 0 | Decision Tree Classifier Method | 0.947368 |
| 0 | Random Forest Classifier Method | 0.982456 |
In [85]:
# Support Vector Classifier
In [86]:
from sklearn import svm
svc = svm.SVC()
svc.fit(X_train, y_train)
Out[86]:
SVC(C=1.0, break_ties=False, cache_size=200, class_weight=None, coef0=0.0,
    decision_function_shape='ovr', degree=3, gamma='scale', kernel='rbf',
    max_iter=-1, probability=False, random_state=None, shrinking=True,
    tol=0.001, verbose=False)
In [87]:
y_pred = svc.predict(X_test)
y_pred
Out[87]:
array([1, 1, 0, 0, 0, 0, 0, 1, 0, 0, 1, 1, 1, 1, 0, 0, 0, 1, 0, 1, 1, 0,
       0, 1, 0, 0, 1, 1, 0, 0, 0, 1, 0, 1, 1, 0, 0, 1, 1, 0, 0, 0, 1, 0,
       0, 1, 0, 0, 1, 0, 0, 0, 1, 0, 1, 0, 0, 1, 0, 1, 0, 0, 1, 1, 0, 1,
       0, 0, 0, 0, 0, 0, 0, 0, 0, 0, 0, 1, 1, 0, 0, 1, 0, 0, 0, 1, 1, 1,
       0, 0, 0, 0, 0, 0, 0, 0, 0, 1, 0, 0, 0, 0, 0, 0, 0, 1, 0, 1, 1, 0,
       0, 0, 0, 0, 1, 1, 0, 0, 0, 0, 0, 0, 0, 1, 1, 1, 0, 1, 1, 0, 1, 0,
       1, 0, 1, 1, 0, 0, 1, 1, 0, 0, 0, 0, 1, 0, 0, 0, 1, 0, 0, 1, 1, 0,
       0, 0, 0, 0, 0, 0, 0, 1, 1, 0, 0, 1, 0, 0, 1, 0, 0])
In [88]:
from sklearn.metrics import accuracy_score
print(accuracy_score(y_test, y_pred))
0.9883040935672515
In [89]:
svm_acc = accuracy_score(y_test, y_pred)
print(svm_acc)
0.9883040935672515
In [90]:
tempResults = pd.DataFrame({'Algorithm':['Support Vector Classifier Method'], 'Accuracy':[svm_acc]}) #Headings Algorithm and Accuracy
results = pd.concat([results,tempResults])
results = results[['Algorithm','Accuracy']]
results
Out[90]:
| Algorithm | Accuracy | |
|---|---|---|
| 0 | Logistic Regression Method | 0.988304 |
| 0 | Decision Tree Classifier Method | 0.947368 |
| 0 | Random Forest Classifier Method | 0.982456 |
| 0 | Support Vector Classifier Method | 0.988304 |
最后,我得出结论,对于我们的预测,准确率得分达到了 98.2456%。
Logistic Regression 最适合这个特定的机器学习模型。
8.代码项目联系

脑启社区是一个专注类脑智能领域的开发者社区。欢迎加入社区,共建类脑智能生态。社区为开发者提供了丰富的开源类脑工具软件、类脑算法模型及数据集、类脑知识库、类脑技术培训课程以及类脑应用案例等资源。
更多推荐

 23
23 0
0- 0


 已为社区贡献9条内容

所有评论(0)