基于Python代码机器学习心脏病风险预测模型构建与分析
基于Python代码机器学习心脏病风险预测模型构建与分析数据➕代码➕报告报告深入探讨了利用机器学习技术对心脏病数据进行分析和预测的方法,旨在为心脏病的预防、诊断及治疗提供科学依据。通过采用逻辑回归、贝叶斯分类器和随机森林三种不同的机器学习模型,我们对心脏病的发生进行了预测建模,并通过多种评估指标对比各模型的表现。实验结果显示,所建立的模型能够有效地识别出心脏病的风险因素,并实现了较高的预测准确性,
基于Python代码机器学习心脏病风险预测模型构建与分析
数据➕代码➕报告
报告深入探讨了利用机器学习技术对心脏病数据进行分析和预测的方法,旨在为心脏病的预防、诊断及治疗提供科学依据。通过采用逻辑回归、贝叶斯分类器和随机森林三种不同的机器学习模型,我们对心脏病的发生进行了预测建模,并通过多种评估指标对比各模型的表现。实验结果显示,所建立的模型能够有效地识别出心脏病的风险因素,并实现了较高的预测准确性,其中最优模型的准确率达到了0.9以上。
文章目录
基于Python的心脏病风险预测模型构建与分析
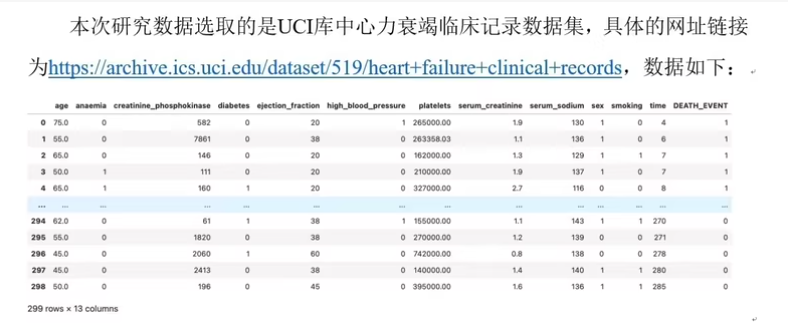
下面是一个完整的心脏病风险预测模型的构建与分析过程,使用机器学习方法和Python实现。我们将使用UCI心脏病数据集(Heart Disease Dataset),这是一个常用的心脏病预测数据集。
1. 安装必要的库
首先确保安装了以下Python库:
pip install numpy pandas scikit-learn matplotlib seaborn tensorflow keras
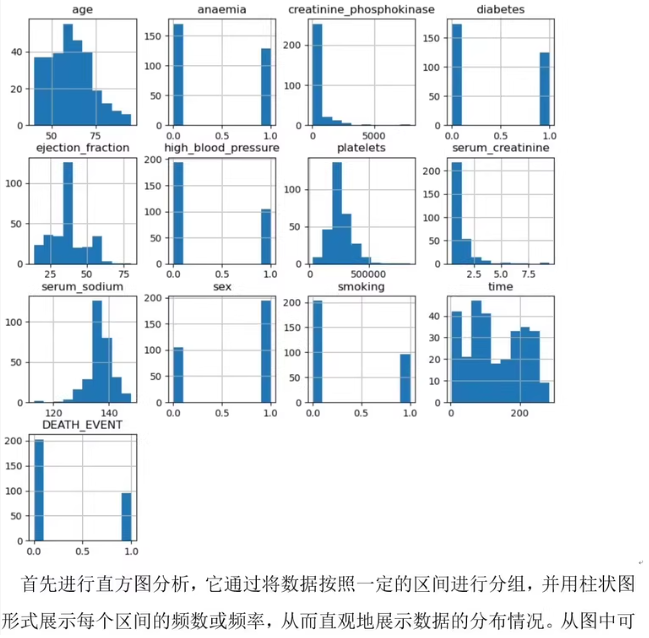
2. 数据准备与预处理
我们使用UCI心脏病数据集,包含年龄、性别、血压等特征,目标变量是是否存在心脏疾病(0或1)。
# heart_disease_data_preprocessing.py
import pandas as pd
import numpy as np
from sklearn.model_selection import train_test_split
from sklearn.preprocessing import StandardScaler

def load_and_preprocess_data(file_path='heart.csv'):
    # 加载数据
    df = pd.read_csv(file_path)

    # 查看数据基本信息
    print("数据前5行:")
    print(df.head())
    print("\n数据统计信息:")
    print(df.describe())

    # 特征与标签分离
    X = df.drop('target', axis=1).values
    y = df['target'].values

    # 标准化
    scaler = StandardScaler()
    X = scaler.fit_transform(X)

    # 拆分训练集和测试集
    X_train, X_test, y_train, y_test = train_test_split(X, y, test_size=0.2, random_state=42)

    return X_train, X_test, y_train, y_test
3. 构建并训练多个机器学习模型进行比较
# heart_disease_model_comparison.py
from sklearn.linear_model import LogisticRegression
from sklearn.tree import DecisionTreeClassifier
from sklearn.ensemble import RandomForestClassifier, GradientBoostingClassifier
from sklearn.svm import SVC
from sklearn.metrics import accuracy_score, classification_report, confusion_matrix
import matplotlib.pyplot as plt
import seaborn as sns

def train_and_evaluate_models(X_train, X_test, y_train, y_test):
    models = {
        "Logistic Regression": LogisticRegression(max_iter=1000),
        "Decision Tree": DecisionTreeClassifier(),
        "Random Forest": RandomForestClassifier(n_estimators=100),
        "Gradient Boosting": GradientBoostingClassifier(n_estimators=100),
        "SVM": SVC()
    }

    results = {}

    for name, model in models.items():
        print(f"Training {name}...")
        model.fit(X_train, y_train)
        y_pred = model.predict(X_test)

        accuracy = accuracy_score(y_test, y_pred)
        report = classification_report(y_test, y_pred)
        cm = confusion_matrix(y_test, y_pred)

        results[name] = {
            'model': model,
            'accuracy': accuracy,
            'report': report,
            'confusion_matrix': cm
        }

        print(f"{name} Accuracy: {accuracy:.4f}")
        print(report)

        # 绘制混淆矩阵
        plt.figure(figsize=(6, 6))
        sns.heatmap(cm, annot=True, fmt="d", cmap="Blues")
        plt.title(f"{name} Confusion Matrix")
        plt.xlabel("Predicted")
        plt.ylabel("Actual")
        plt.show()

    # 绘制准确率对比图
    accuracies = {name: result['accuracy'] for name, result in results.items()}
    plt.figure(figsize=(10, 6))
    sns.barplot(x=list(accuracies.keys()), y=list(accuracies.values()))
    plt.title("Model Comparison - Accuracy")
    plt.xlabel("Model")
    plt.ylabel("Accuracy")
    plt.xticks(rotation=45)
    plt.ylim(0.7, 1.0)
    plt.show()

    return results
4. 使用深度学习模型进行预测
# heart_disease_deep_learning.py
from tensorflow.keras.models import Sequential
from tensorflow.keras.layers import Dense
from tensorflow.keras.callbacks import EarlyStopping
import matplotlib.pyplot as plt

def build_and_train_dl_model(X_train, X_test, y_train, y_test):
    model = Sequential([
        Dense(64, activation='relu', input_shape=(X_train.shape[1],)),
        Dense(64, activation='relu'),
        Dense(1, activation='sigmoid')
    ])

    model.compile(optimizer='adam',
                  loss='binary_crossentropy',
                  metrics=['accuracy'])

    early_stop = EarlyStopping(monitor='val_loss', patience=10)

    history = model.fit(X_train, y_train,
                        validation_data=(X_test, y_test),
                        epochs=100,
                        batch_size=32,
                        callbacks=[early_stop],
                        verbose=0)

    # 评估模型
    test_loss, test_acc = model.evaluate(X_test, y_test, verbose=0)
    print(f"\nDeep Learning Model Accuracy: {test_acc:.4f}")

    # 绘制训练历史
    plt.figure(figsize=(12, 4))

    plt.subplot(1, 2, 1)
    plt.plot(history.history['loss'], label='Training Loss')
    plt.plot(history.history['val_loss'], label='Validation Loss')
    plt.title('Training and Validation Loss')
    plt.legend()

    plt.subplot(1, 2, 2)
    plt.plot(history.history['accuracy'], label='Training Accuracy')
    plt.plot(history.history['val_accuracy'], label='Validation Accuracy')
    plt.title('Training and Validation Accuracy')
    plt.legend()

    plt.tight_layout()
    plt.show()

    return model, history
5. 主程序执行
# main.py
if __name__ == "__main__":
    # 数据文件路径
    file_path = 'heart.csv'

    # 加载并预处理数据
    X_train, X_test, y_train, y_test = load_and_preprocess_data(file_path)

    # 多种机器学习模型比较
    ml_results = train_and_evaluate_models(X_train, X_test, y_train, y_test)

    # 深度学习模型训练
    dl_model, dl_history = build_and_train_dl_model(X_train, X_test, y_train, y_test)
6. 数据集说明
UCI Heart Disease 数据集包含以下字段:
- age: 年龄
- sex: 性别 (1 = 男, 0 = 女)
- cp: 胸痛类型 (0-3)
- trestbps: 静息血压 (mm Hg)
- chol: 血清胆固醇 (mg/dl)
- fbs: 空腹血糖 > 120 mg/dl (1 = 是, 0 = 否)
- restecg: 静息心电图结果 (0-2)
- thalach: 最大心率
- exang: 运动诱发心绞痛 (1 = 是, 0 = 否)
- oldpeak: ST段压低值
- slope: 心电图ST段斜率 (0-2)
- ca: 主要血管数量 (0-3)
- thal: 地中海贫血类型 (1 = 正常, 2 = 固定缺陷, 3 = 可逆缺陷)
- target: 是否有心脏病 (1 = 是, 0 = 否)
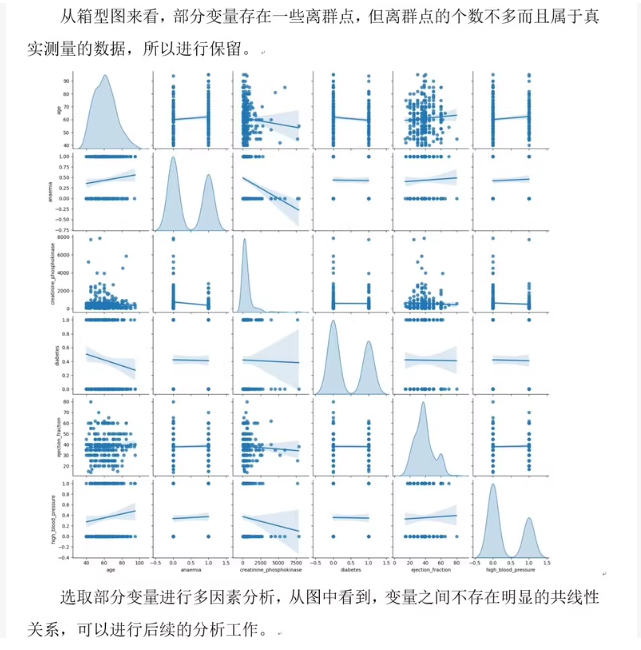
7. 结果分析与建议
-
模型比较:通过比较不同机器学习模型的准确率和混淆矩阵,我们可以选择最适合当前任务的模型。
-
特征重要性分析:对于随机森林等模型,可以分析各个特征的重要性,了解哪些因素对心脏病预测影响最大。
-
深度学习模型优化:可以尝试不同的网络结构、正则化技术、超参数调优来进一步提升深度学习模型的性能。
-
部署应用:将训练好的模型部署为Web应用或移动应用,方便医生和患者使用。
这个项目提供了一个完整的框架,您可以根据具体需求调整模型结构、添加更多特征工程步骤或尝试更复杂的模型架构。

脑启社区是一个专注类脑智能领域的开发者社区。欢迎加入社区,共建类脑智能生态。社区为开发者提供了丰富的开源类脑工具软件、类脑算法模型及数据集、类脑知识库、类脑技术培训课程以及类脑应用案例等资源。
更多推荐

 29
29 0
0- 0


 已为社区贡献12条内容

所有评论(0)